
Assessment Results July 2025
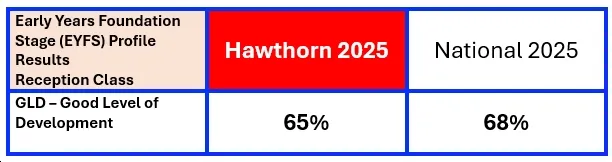
Early Years Foundation Stage Profile Results - Summer 2025
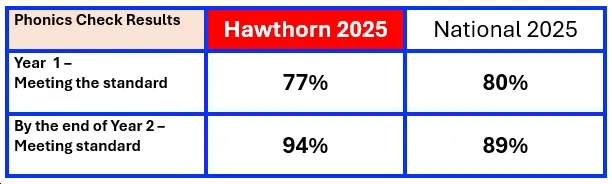
Phonics Check Assessment Results - Summer 2025
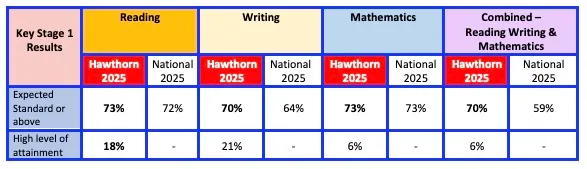
Key Stage 1 Teacher Assessment Results - Summer 2025 (Non Statutory)
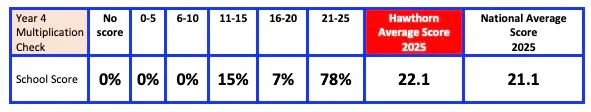
Key Stage 2 - Year 4 Multiplication Tables Check (MTC) Results - Summer 2025
Key Stage 2 Assessment Results - Summer 2025
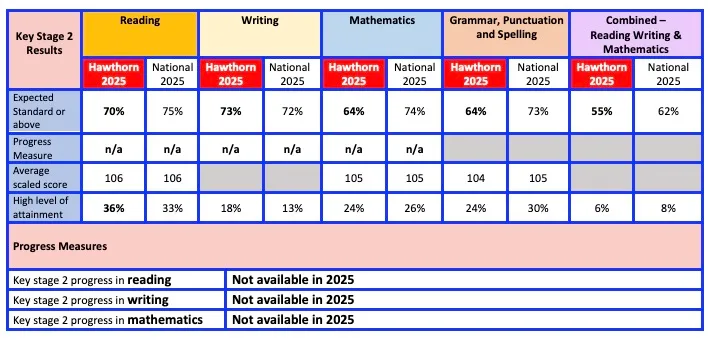
What progress measures mean
Most schools will have progress scores between −5 and +5.
If a school has a progress score of 0 this means that on average their pupils achieved similar results at the end of KS2 (end of year 6) to pupils in other schools with similar results at the end of KS1 (end of year 2).
If a school has a positive progress score this means that on average their pupils made more progress than pupils in other schools with similar results at the end of KS1.
School Performance Tables
Search for primary, secondary and special needs schools and colleges near you, and check
their performance. You can view and download:
- exam and test results
- Ofsted reports
- financial information
Click here to take you to the DfE School Performance homepage